
What "shrinkage" actually looks like once you can see the photo behind the number.
A quarterly shrinkage percentage hides a lot. A photo of the actual shelf, pallet, or damaged case tells a very different story.
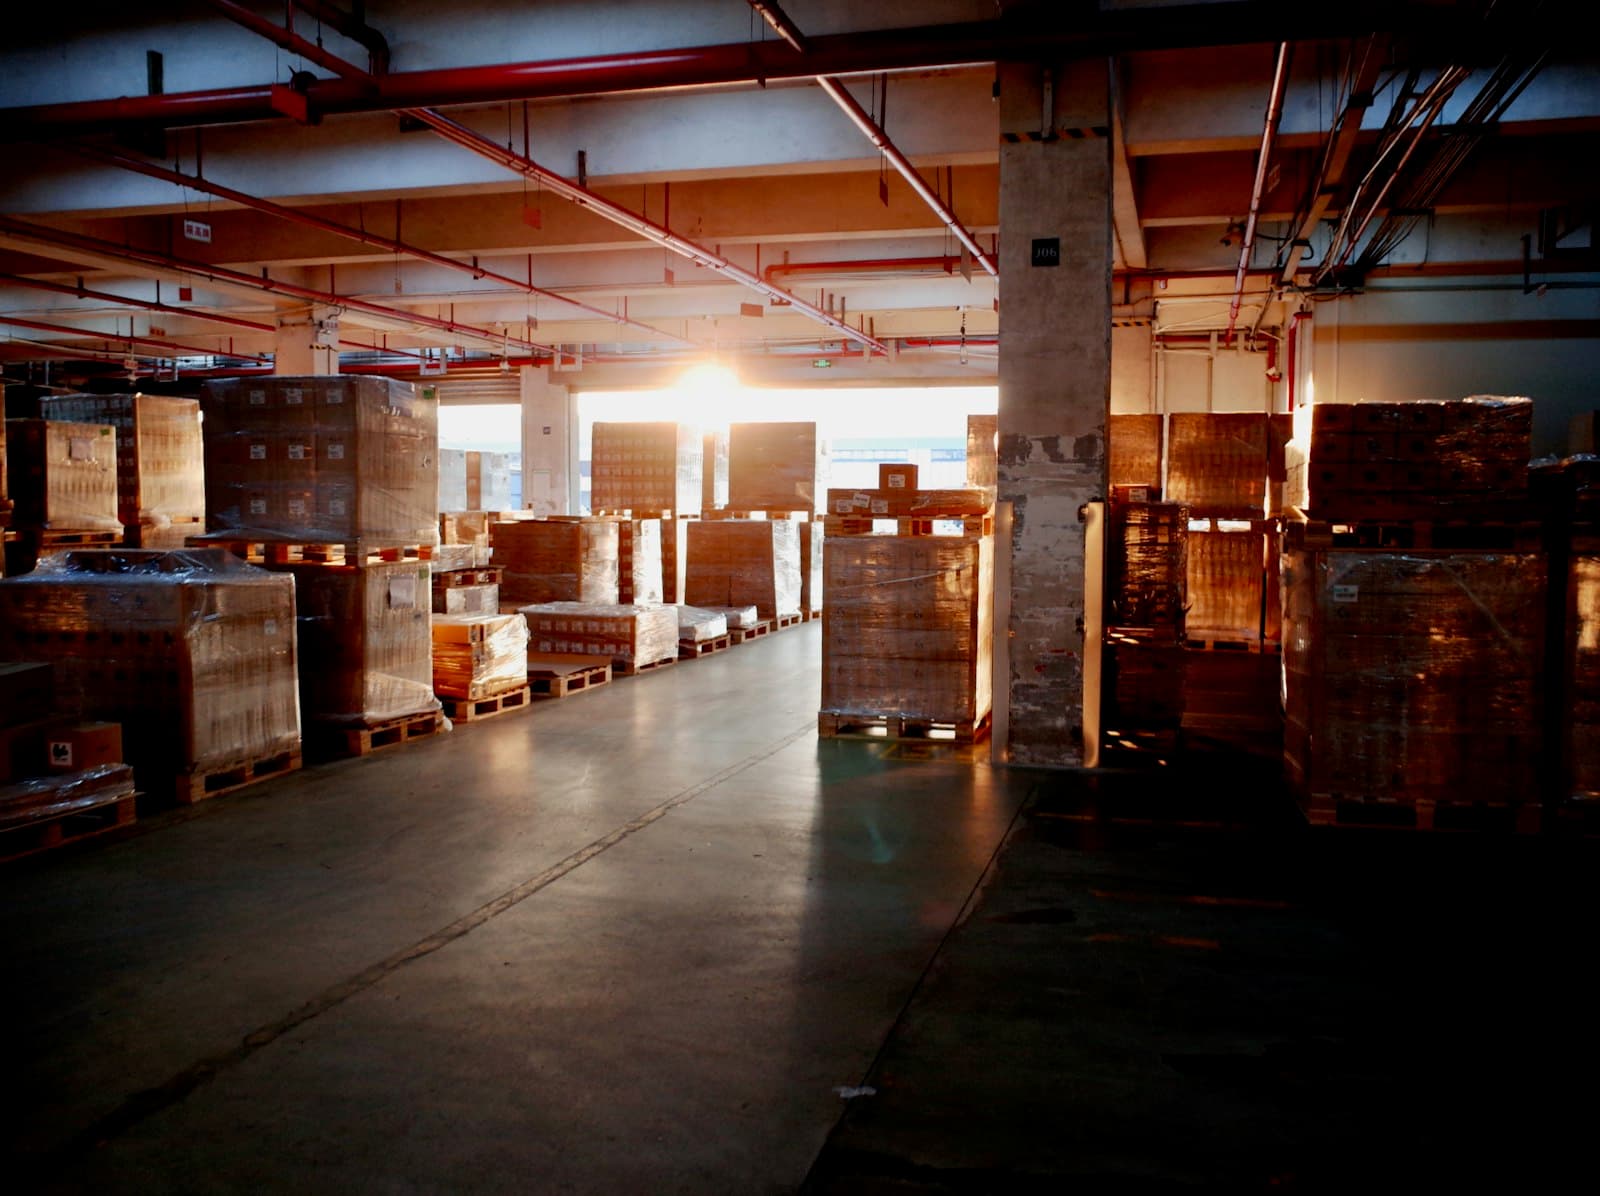
Most operators know their shrinkage rate as a single quarterly number produced by a cycle count. It tells you that units went missing sometime in the last 90 days. It can't tell you whether that happened during one bad shift or gradually across every aisle.
From a Number to a Photo
When a flag comes with the actual photo attached, "shrinkage" stops being an abstract percentage and starts being a specific, visible thing: a pallet in the wrong bay, a case with a torn corner, a shelf facing that's thinner than it should be. That's a very different starting point for a conversation with your team.
A Small, Early Pattern We're Watching
In the handful of pilot facilities we're working with so far, a meaningful share of what gets flagged turns out to be misplacement rather than actual loss — the inventory was never gone, just in the wrong spot. We don't have enough data yet to call that a proven number across the industry, but it's consistent enough across our early pilots that we think it's worth watching.
“Once you can see where a discrepancy happened, a lot of what gets called "shrinkage" turns out to be a location problem, not a loss problem.”
That distinction changes how a team responds: a misplacement problem gets fixed with better slotting discipline, while a genuine loss problem gets escalated to security and process review. Getting that distinction right is exactly why we think a photo, not just a number, belongs in the conversation.